Tiff to Dose module
Overview
OMG Dosimetry tiff2dose module.
The film-to-dose module performs optimized multichannel conversion from scanned gafchromic films to absolute dose. It uses the optimized multichannel method from Mayer et al (https://doi.org/10.1118/1.3694100) and calibration curves obtained with the calibration module.
- Features:
Multiple scans of same film are loaded and averaged automatically
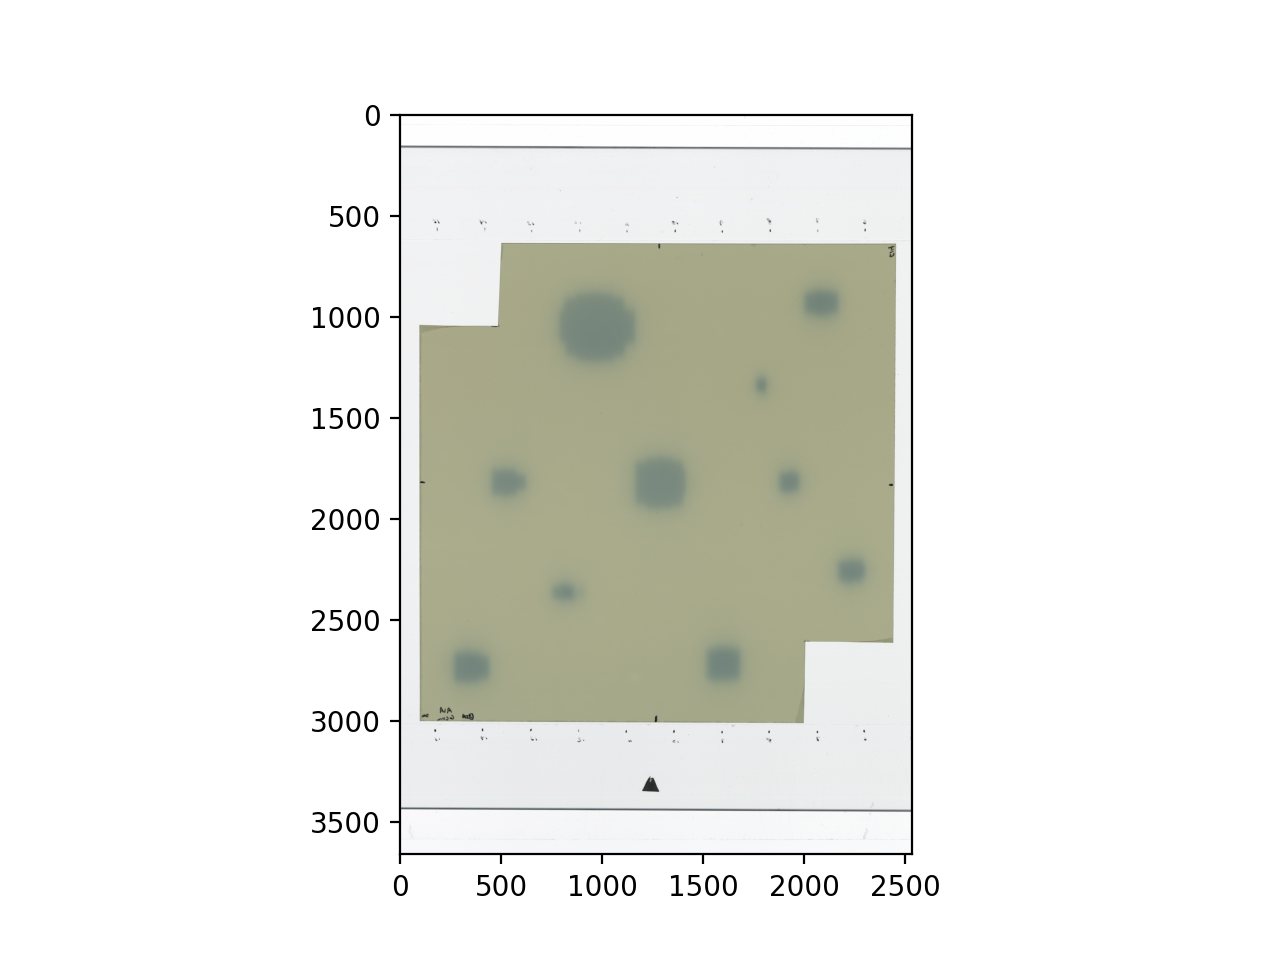
Automatic film detection and cropping
Multichannel optimized conversion to absolute dose (reduced film inhomogeneities/artefacts)
Lateral scanner response is accounted for if this feature was turned on during calibration
Calibration curves interpolation performed by fitting either a rational function or spline curve
Output individual channels dose (R/G/B), as well as optimized dose, mean channel dose and average dose
Output metrics for evaluation of dose conversion quality: disturbance map, residual error, consistency map
Publish PDF report
Written by Jean-Francois Cabana, copyright 2018.
Modified by Peter Truong (CISSSO) and Luis Alfonso Olivares Jimenez.
Version: 2025-06-27
Running the Demo
To run the demo, import the main class and run the demo method:
from omg_dosimetry.tiff2dose import Gaf

Gaf.run_demo()
(Source code, png, hires.png, pdf)
Usage
Import Gaf and Path:
from omg_dosimetry.tiff2dose import Gaf
from pathlib import Path
Define the folder containing the scanned tiff images, and path to LUT file
path_to_tif_folder = Path(r"C:/my/folder/tifQA")
path_to_lut_file = Path(r"/my/folder/lut_calib.pkl")
If you don’t have an image you can load the demo image and lut files:
from omg_dosimetry import tiff2dose

path_to_tif_folder = tiff2dose.from_demo_image()
path_to_lut_file = tiff2dose.from_demo_lut()
(Source code, png, hires.png, pdf)

Define the function type used for fitting calibration curve. ‘rational’ (recommended) or ‘spline’
fit_type = 'rational'
Maximum value [cGy] to limit dose. Useful to avoid very high doses obtained due to markings on the film.
clip = 500
Produce the Gaf object
gaf = Gaf(path_to_tif_folder, lut_file=path_to_lut_file, fit_type=fit_type, clip=clip)
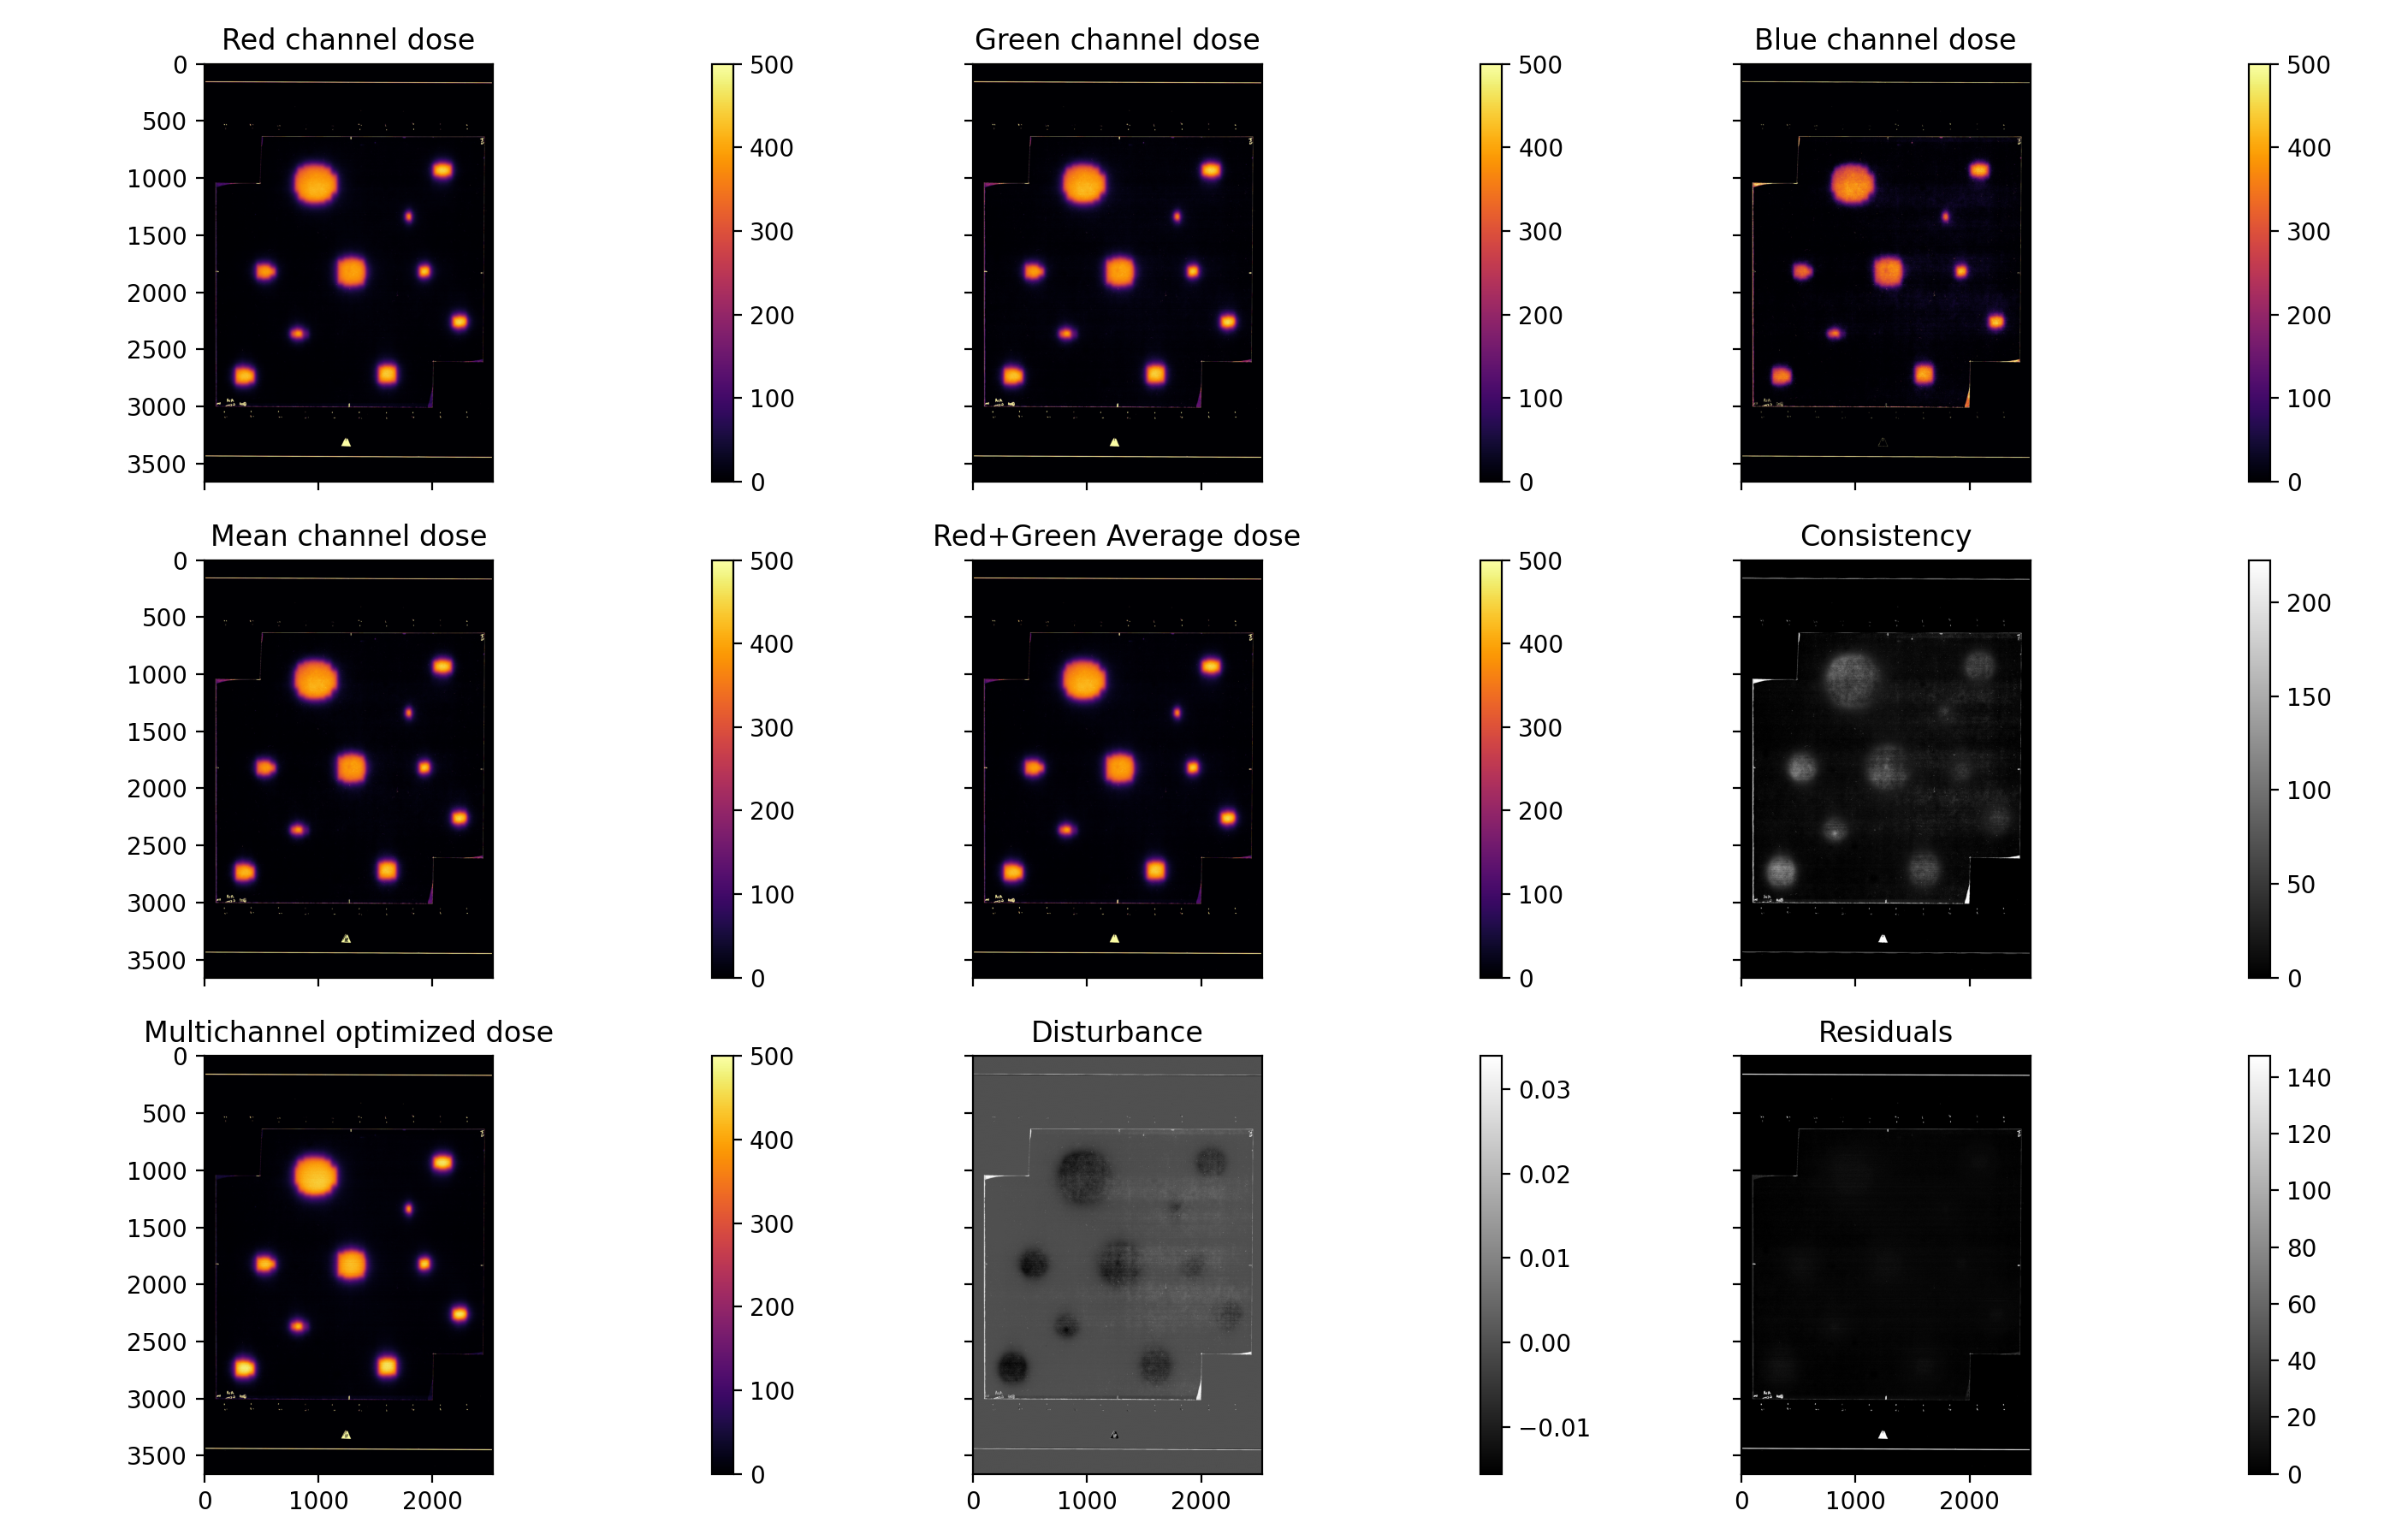
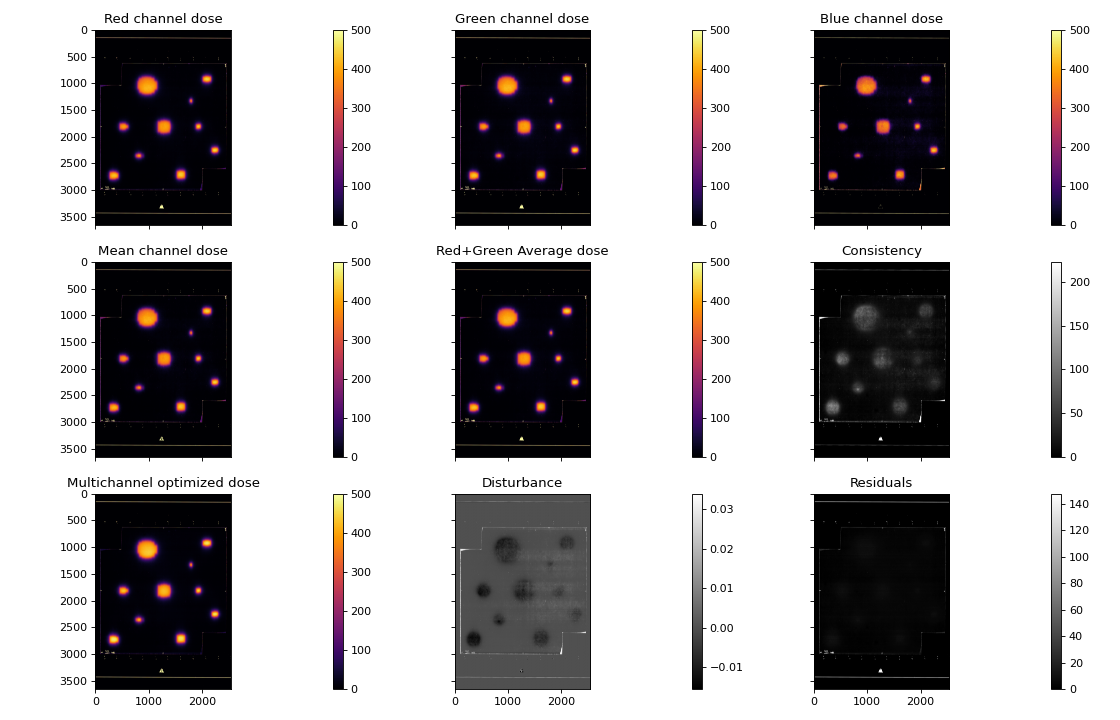
Display a figure with the different converted dose maps and metrics.
gaf.show_results()
API Documentation
Main class
- class omg_dosimetry.tiff2dose.Gaf(path='', lut_file='', img_filt=0, lut_filt=35, fit_type='rational', k=3, ext=3, s=None, info=None, crop_edges=0, clip=None, flipLR=False, flipUD=False, rot90=0)[source]
Base class for gafchromic films converted to dose.
- Parameters:
path (str) – File path of scanned tif images of film to convert to dose. Multiple scans of the same films should be named (someName)_00x.tif These files will be averaged together to increase SNR.
lut_file (str) – File path to LUT film to use for dose conversion.
img_filt (int, optional) – Kernel size of median filter to apply to image before conversion to dose. Default is 0.
lut_filt (int, optional) – Kernel size of median filter to apply to LUT data before conversion to dose. Used only on LUT with lateral scanner correction applied. Default is 35.
fit_type ('rational' or 'spline') – Function type used for fitting calibration curve. Default is ‘rational’. If fit_type = “spline”, the fitted function is UnivariateSpline from scipy.interpolate. ‘k’, ‘ext’, and ‘s’ are parameters to pass to this function.
k (int, optional) – Degree of the smoothing spline. Must be 1 <= k <= 5.
k = 3is a cubic spline. Default is 3.s (float or None, optional) – Positive smoothing factor used to choose the number of knots. Number of knots will be increased until the smoothing condition is satisfied:: sum((w[i] * (y[i]-spl(x[i])))**2, axis=0) <= s If s is None,
s = len(w)which should be a good value if1/w[i]is an estimate of the standard deviation ofy[i]. If 0, spline will interpolate through all data points. Default is None.ext (int or str, optional) – Controls the extrapolation mode for elements not in the interval defined by the knot sequence. * if ext=0 or ‘extrapolate’, return the extrapolated value. * if ext=1 or ‘zeros’, return 0 * if ext=2 or ‘raise’, raise a ValueError * if ext=3 of ‘const’, return the boundary value. Default is 0.
info (dictionary, optional) – Used to store information that will be shown on the PDF report. key:value pairs must include “author”, “unit”, “film_lot”, “scanner_id”, date_exposed”, “date_scanned”, “wait_time”, “notes” Default is None.
crop_edges (int, optional) – If not 0, dose arrays will be cropped to remove empty areas around the film. The actual value determines the threshold used for detecting what is considered non-film area. Default is 0.
clip (float, optional) – Maximum value [cGy] to limit dose. Useful to avoid very high doses obtained due to markings on the film. Default is None.
flipLR (bool, optional, default=False) – Whether or not to flip the film dose horizontally to match reference dose orientation.
flipUD (bool, optional, default=False) – Whether or not to flip the film dose vertically to match reference dose orientation.
rot90 (int, optional) – Number of 90 degrees rotations to apply to the image. Default is 0.
- gaf.dose_r
- Type:
ArrayImage object of dose from red channnel
- gaf.dose_g
- Type:
ArrayImage object of dose from green channnel
- gaf.dose_b
- Type:
ArrayImage object of dose from blue channnel
- gaf.dose_m
- Type:
ArrayImage object of dose from mean channnel (dose_m = dose_((r+g+b/3)))
- gaf.dose_ave
- Type:
ArrayImage object of averaged dose from channels R+G+B ((dose_ave = dose_r + dose_g + dose_b) / 3)
- gaf.dose_rg
- Type:
ArrayImage object of averaged dose from channels R+G ((dose_ave = dose_r + dose_g) / 2)
- gaf.dose_opt
- Type:
ArrayImage object of optimized dose (eq. 6 in Mayer et al)
- gaf.dose_opt_delta
- Type:
ArrayImage object of disturbance map (eq. 7 in Mayer et al)
- gaf.dose_opt_RE
- Type:
ArrayImage object of residual error (eq. 2 in Mayer et al)
- gaf.dose_consistency
- Type:
ArrayImage object of disagreement between individual channels (RMSE of (dose_r-dose_g) + (dose_r-dose_b) + (dose_b-dose_g))
Example
gaf = tiff2dose.Gaf(
    path='path/to/scanned/tiff/images',
    lut_file='path/to/calibration/file'
)
- apply_factor_from_roi(norm_dose)[source]
Apply film normalisation factor from a rectangle ROI. Brings up an interactive plot, where the user must define a rectangle ROI that will be used to compute a film normalisation factor. Median dose inside this rectangle will be used to scale the film dose to match that of the reference.
- apply_factor_from_roi_press_enter(event)[source]
Function called from apply_factor_from_roi() when ‘’enter’’ is pressed.
- convert2dose(img_filt=0, lut_filt=35, fit_type='rational', k=3, ext=3, s=0)[source]
Performs the conversion of scanned image to dose [cGy].
- load_files(path)[source]
Load image files found in path. If path is a directory, it is assumed to contains multiples scans of a single film. If a directory contains scans of multiple films, then path should be a full path to a single image. Files sharing the same filename but ending with _00x in this directory are assumed to be scans of the same film and will be averaged together to increse SNR.
- publish_pdf(filename=None, author=None, unit=None, notes=None, open_file=False)[source]
Publish a PDF report of the calibration. The report includes basic file information, the image and determined ROIs, and the calibration curves
- Parameters:
filename (str) – The path and/or filename to save the PDF report as; must end in “.pdf”.
author (str, optional) – The person who analyzed the image.
unit (str, optional) – The machine unit name or other identifier (e.g. serial number).
notes (str, list of strings, optional) – If a string, adds it as a line of text in the PDf report. If a list of strings, each string item is printed on its own line. Useful for writing multiple sentences.
open_file (bool, optional) – Whether or not to open the PDF file after it is created. Default is False.
- static run_demo(show=True) None[source]
Run the Gaf demo by loading the demo image and print results.
- Parameters:
show (bools) – Display a summary of the results.